

Here are some important questions for Class 10 Mathematics Chapter 13, Statistics, carefully selected to help students prepare effectively for the CBSE Class 10 Mathematics Examination in 2023-24. By practicing these diverse problems, students can improve their understanding of Statistics concepts and enhance their problem-solving abilities. These questions are designed to clarify doubts and contribute to better performance in the Statistics chapter.
In Chapter 13 of Class 10 Mathematics,Statistics, we will focus on understanding and calculating the measures of central tendency—mean, median, and mode—for grouped data. These measures help us analyze and summarize large sets of data by providing insights into the typical values and trends within the data.
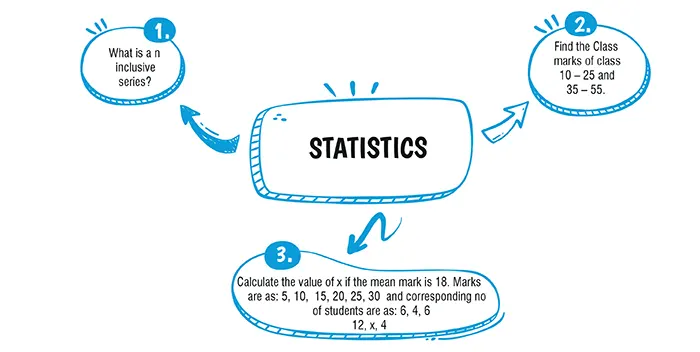
Statistics involves collecting, analyzing, and interpreting data to understand trends, patterns, and information in various fields. It helps in making informed decisions and drawing conclusions.
Ans. (d)
Explanation:
The lower and upper class boundaries are contained within the class and do not intersect with either the upper boundary of the previous class or the lower boundary of the next class.
Ans. (b)17.5 and 4.5
Explanation:
Explanation: We derive the class mark xi by the following formula :
xi=\(\frac{1}{2}\) (lower limit + upper limit)
Thus, xi=\(\frac{1}{2}\)(10 + 25)
=\(\frac{1}{2}\)(35)=17.5
And xii = \(\frac{1}{2}\) (lower limit + upper limit)
Thus, xii =\(\frac{1}{2}\)(35 + 55)
=\(\frac{1}{2}\)(90) = 45
Ans. x = 8
Explanation:
Given Mean = 18
Mean = \(\frac{\Sigma f_ix_i}{\Sigma f_i}\)
18 = 520 + 25 x/32+ x
18(32+x) = 520 +25x
576-520 = 25x-18x
X = 8
Ans. Mean = 143
Explanation:
Explanation:
Mean = Σfixi/Σfi = 7150/50
= 143
Ans. 149.2
Explanation:
Sum up all the heights: Sum = 140 + 142 + 145 + 150 + 148 + 152 + 156 + 145 + 146 + 144 + 149 + 151 + 153 + 148 + 142 + 147 + 149 + 155 + 146 + 144 + 147 + 150 + 153 + 147 + 145 + 149 + 151 + 153 + 152 + 148
Sum = 4476
Calculate the mean:
Mean = Sum / Total number of students
Mean = 4476 / 30
Mean = 149.2 cm


To enhance your grasp of the Statistics chapter, consider exploring oswal.io. This website provides a variety of practice questions tailored to facilitate better learning. By engaging with these questions, you can reinforce your understanding of statistical concepts and improve your problem-solving abilities in this important math topic.
Ans: Data refers to information or observations collected for analysis. Raw data is the original, unprocessed form of data before any organization or manipulation.
Ans: Statistics is a branch of mathematics that involves collecting, organizing, analyzing, interpreting, and presenting data. It provides methods for understanding patterns, trends, and relationships in data.
Ans: The median is the middle value of a dataset when arranged in ascending or descending order. It divides the data into two equal halves.
Ans: Grouped data is data that is categorized into intervals or classes. It simplifies data representation when dealing with large datasets.
Ans: The midpoint of a class interval is calculated by adding the lower and upper limits of the interval and dividing by 2.

----------------------------------------------------------------------------------------------------------------------------------------------------------------------------------------------------------------
Phone: (+91) 7895987722
Mail: support@oswalpublishers.in
Ground Floor, 1 / 12 Sahitya Kunj, M.G Road
Agra – 282002,Uttar Pradesh (India)
+91-562-25277711/2/3/4 or +91-7455077222
support@oswalpublishers.in
Noida One, B 702, B7, Sector 62, Noida,
Uttar Pradesh 201309
+91-745 507 7222
support@oswalpublishers.in